Cross-section
The goal is to create a cross-section using COSMO data. The data will be loaded from a NetCDF file. In order to reduce the amount of data loaded, we will only load the data from the bounding box of the cross-section.
Parameters
Here we define the variables that we will read, the coordinates of the cross-section, as ((startlon, startlat), (endlon, endlat)), and the pressure coordinates of the cross-section:
>>> filename = 'lffd2000101302.nc'
>>> cstfile = 'lffd2000101300c.nc'
>>> variables = ['QV', 'T', 'P', 'PS]
>>> coos = ((8, 45), (8, 48))
>>> pressure = np.arange(200, 1010, 10)
Read the data
First we read the coordinates of the rotated grid from the constant file:
>>> rlon, rlat = read_var(cstfile, ['rlon', 'rlat'])
Then we can read the variables from within the bounding box, as well as the coordinates of the bounding box grid. The index of the bounding box grid points are saved as well to reduce later rlon, rlat and others to the bounding box grid:
>>> lon, lat, qv, t, p, ps, index = read_var_bbox(filename, variables,
                                                  (7.5, 8.5, 44.8, 48.1),
                                                  return_index=True)
Create the cross-section
We are now ready to define the cross-section, for this we will use the CrossSection class from the small tools package:
>>> from dypy.small_tools import CrossSection
The docstring (help) of the class can be found here dypy.small_tools.CrossSection
It shows that the class need at least three arguments, a dictionary of variables, the coordinates of the cross-section, and the vertical coordinates of the cross-section.
The last two are already defined, we just need to define the dictionary of variables:
>>> variables = {'qv': qv * 1000,
                 't': t,
                 'p': p / 100,
                 'rlon': rlon[index[-1]],
                 'rlat': rlat[index[-2]],
                 'ps': ps / 100}
We can now define the cross-section, using one extra optional argument. The switch int2p can be used if the variables need to be interpolated on pressure levels:
>>> cross = CrossSection(variables, coos, pressure, int2p=True)
Note
The CrossSection class has predefined values for pollon and pollat. Make sure to set them to your own setting if you are using the rotated version (default):
>>> CrossSection(pollon=-170, pollat=62)
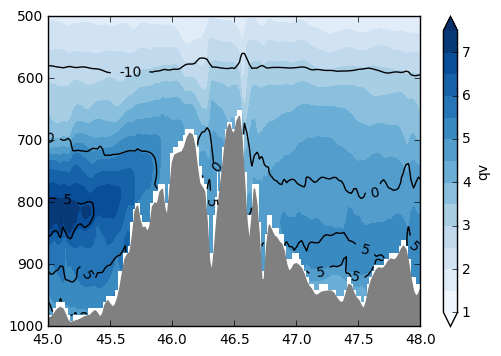
Create the plot
First, we need to create the grid on which to plot using here the latitude (along the cross-section) and the pressure coordinates:
>>> x, zi = np.meshgrid(cross.lat, cross.pressure)
Then, we can create the plot, using PS for plotting the topography:
>>> fig, ax = plt.subplots()
>>> ax.set_ylim(ymin=500, ymax=1000)
>>> ax.invert_yaxis()
>>> cf = ax.contourf(x, zi, cross.qv, levels=np.arange(1, 8, 0.5), extend='both', cmap='Blues')
>>> cb = fig.colorbar(cf)
>>> cb.set_label('qv')
>>> ct = ax.contour(x, zi, cross.t, levels=[-10, 0, 5], colors='k', linestyles='solid')
>>> ct.clabel(fmt='%1.0f')
>>> ax.fill_between(cross.lat, 1000, cross.ps, color='grey')
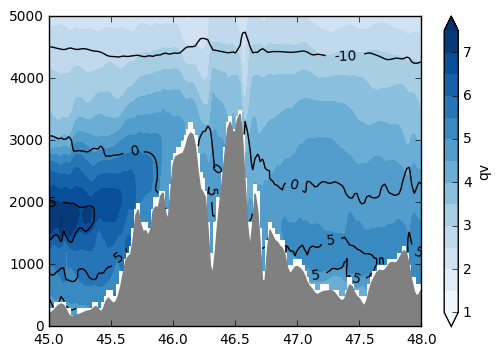
Using height as vertical coordinate
We can define a similar cross-ection but using height as vertical coordinates. For this we need to read HHL and HSURF from the constant file.:
>>>> hhl, hsurf = read_var(cstfile, ['HHL', 'HSURF'])
>>> z = (hhl[1:, ...] + hhl[:-1, ...]) / 2
We add them to the variables dictionary, and change the vertical coordinates of the cross-section:
>>> variables['z'] = z[index[1:]]
>>> variables['hsurf'] = hsurf[index[2:]]
>>> heights = np.arange(0, 10000, 100)
We can know create the cross-section, using now the optional arguments int2z (the z variable is required) and flip (we need monotically increasing data):
>>> cross = CrossSection(variables, coos, heights, int2z=True, flip=True)
We can know define the plot as follow:
>>> x, zi = np.meshgrid(cross.lat, cross.pressure)
>>> fig, ax = plt.subplots()
>>> ax.set_ylim(ymin=0, ymax=5000)
>>> cf = ax.contourf(x, zi, cross.qv, levels=np.arange(1, 8, 0.5), extend='both', cmap='Blues')
>>> cb = fig.colorbar(cf)
>>> cb.set_label('qv')
>>> ct = ax.contour(x, zi, cross.t, levels=[-10, 0, 5], colors='k', linestyles='solid')
>>> ct.clabel(fmt='%1.0f')
>>> ax.fill_between(cross.lat, 0, cross.hsurf, color='grey')